Reproducible distribution
Run the RTP sample-size demonstration
This tool repeats an illustrative session many times. Each simulated spin either pays zero or one fixed return. The return size is calculated from the entered theoretical RTP and hit probability so the model has the requested long-run mean. Real slots are more complex; this deliberately simple model makes the relationship between sample size and spread visible.
Educational model only. It has one winning outcome and one losing outcome. It excludes multi-level paytables, bonus states, jackpots, maximum-win truncation and certified reel strips. Never present its percentiles as the expected range for a named slot.
Percentiles, not promises
How to read the six outputs
Mean realised RTP averages the return percentages produced by every simulated trial. With enough trials it should sit near the entered theoretical RTP because the payout multiple is constructed to give that expectation. A small difference remains normal random error.
Middle 90% is the interval from the 5th to the 95th percentile of simulated trial results. It describes this simplified model under these exact inputs. It is not a confidence interval for a real game and does not say that 90% of future gambling sessions must stay inside it.
Median realised RTP is the middle trial after sorting. It can differ from the mean when the distribution is uneven. With a low hit probability, many trials can cluster below the theoretical line while a smaller number of high returns pull the mean upward.
Lowest and highest are extremes from the current seeded run. Increasing the trial count usually creates more opportunities to observe an extreme, so these values are not stable limits. The theoretical win cap of a real game is a different concept.
Trials below theory counts how many realised percentages landed below the long-run target. It is not a probability of losing money, because a trial can finish below 96% RTP yet still return some stake, and a result above 96% can still be below 100% break-even.
Expected cost is turnover multiplied by 100% minus theoretical RTP. It stays the same for a given stake, spin count and RTP regardless of hit probability. The actual trial cost remains variable and can be larger, smaller or negative when the trial finishes in profit.
Transparent Bernoulli model
The formula behind every simulated spin
Let the theoretical RTP be r as a decimal and the illustrative hit probability be p. The tool sets the single winning return to r ÷ p times the stake. A win occurs with probability p; otherwise the return is zero. The expected return is therefore p × (r ÷ p) = r.
At the default 96% RTP and 20% hit probability, a simulated win returns 4.8x stake because 0.96 ÷ 0.20 = 4.8. The other 80% of rounds return zero. Across a very large sample the average approaches 0.96 times stake per round.
This is a Bernoulli distribution with a scaled winning outcome. It is useful because the mean is exact and the variance is easy to change. It is unrealistic because a slot normally contains many losing, stake-returning and profitable outcomes, plus stateful bonus features.
The tool calculates realised RTP as total simulated prizes divided by total simulated stakes, multiplied by 100. It does not subtract the initial balance, add deposits or count free feature rounds as new turnover.
All trials use an in-browser seeded pseudorandom generator. The same valid inputs and seed reproduce the same result in this implementation. Reproducibility helps audit a chart; it does not make pseudorandom examples equivalent to regulated game RNG.
Narrower percentages, more turnover
What increasing sample size changes
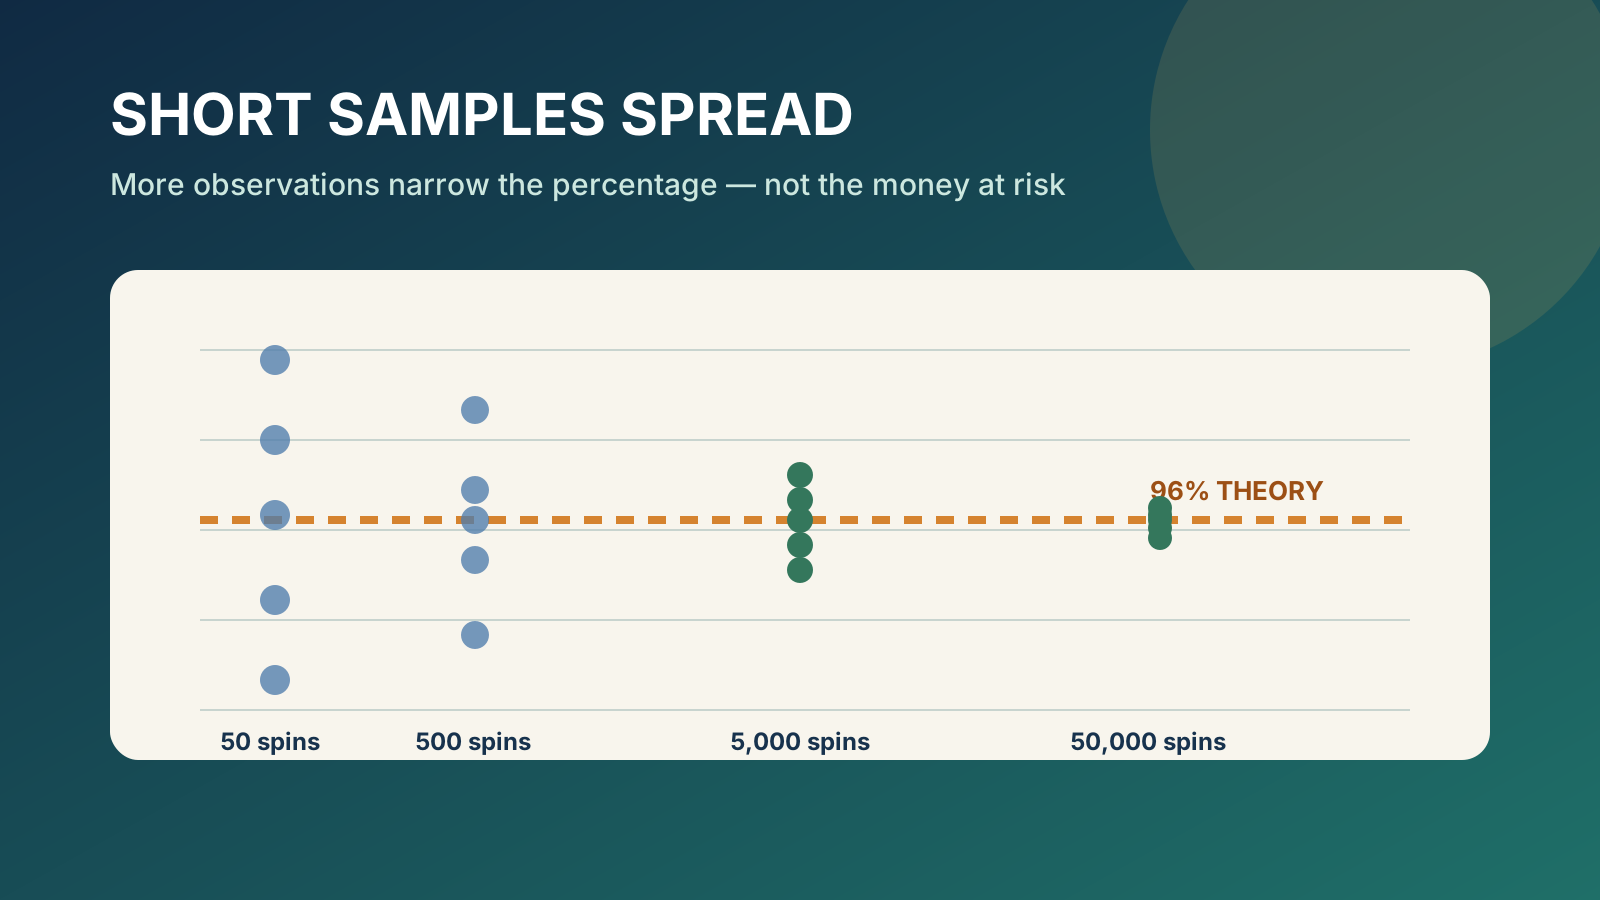
A realised percentage is a sample average. With more independent observations, unusually high or low outcomes have more opportunities to be balanced by other observations. The distribution of the average normally narrows around its expectation.
Try 50 spins, then 500, then 5,000 while keeping RTP, trials, hit probability and seed unchanged. The 5th–95th percentile interval should generally become narrower. It will not shrink perfectly on every seeded comparison because the simulation itself is random.
Narrowing percentages do not mean the player becomes safer in money terms. At NZ$1 per spin, 50 rounds create NZ$50 turnover while 5,000 create NZ$5,000. At 96% theoretical RTP, expected costs are NZ$2 and NZ$200 respectively.
The law of large numbers concerns convergence of the sample average. It does not require a losing personal balance to recover, and it does not create a stopping point at which the game pays the advertised percentage.
A larger monitoring dataset can support a more meaningful comparison between actual and theoretical RTP, but only when game identity, stake records, wins, voids, jackpots and configuration changes are handled correctly. This toy model is not an audit procedure.
Same mean, different spread
Why the hit-probability control matters
RTP alone does not determine session variation. A 96% mean could be produced by frequent small returns or by rare large awards. The illustrative hit control lets the simulator hold RTP constant while changing that distribution.
At 20%, the one win pays 4.8x. At 5%, it pays 19.2x. Both have 96% expectation, but the 5% model produces more all-loss stretches and larger jumps when a hit occurs. Its short-trial histogram should be wider and more visibly stepped.
Do not interpret the control as the hit frequency of the slot named in another article. Real providers may define a hit differently: any non-zero award, an award at least equal to stake, a feature trigger or another event. Only an official definition can make two published rates comparable.
The simulator’s winning outcome also returns the full 4.8x or 19.2x amount; it does not separately add the original stake. This convention is stated so the expected-value formula remains clear.
If hit probability reaches 100%, every spin returns exactly the same amount and realised RTP has no spread in this simplified model. A real 100%-hit product could still vary if its award size changed, showing again that hit rate is not a complete distribution.
Designed versus observed
Theoretical RTP and realised RTP answer different questions
Theoretical RTP comes from the game’s certified mathematical model. It combines every permitted outcome and probability under a particular configuration. A provider or operator may offer several settings under identical artwork.
Realised, or actual, RTP is wins divided by turnover for a recorded sample. It is a historical measurement. A short sample can be far from theory without showing that the game is faulty or that the theoretical percentage was misprinted.
The UK Gambling Commission distinguishes theoretical and actual RTP in its monitoring guidance and uses sample-dependent tolerances. A useful comparison requires substantially more information than a screenshot of a balance after fifty spins.
Use current in-game help for the theoretical setting. If the help says 94%, entering 96% creates a neat but irrelevant demonstration. The slot RTP and house-edge guide explains the source hierarchy and long-run interpretation.
Never reverse the inference. A trial that realises 120% does not prove the game’s theoretical RTP is 120%; a 40% session does not prove it is 40%. Each is one point in a distribution.
Percentages scale; money accumulates
Stake changes money results, not simulated RTP percentages
In this model, multiplying the stake multiplies both turnover and every win by the same factor. The realised RTP percentage is unchanged for a given random path because the factor cancels in prizes divided by stakes.
Money exposure does change. One thousand NZ$0.20 spins create NZ$200 turnover; one thousand NZ$2 spins create NZ$2,000. At 96% RTP their expected costs are NZ$8 and NZ$80.
The expected-cost output is calculated as stake × spins × (1 − RTP). It does not use the number of trials because it describes one trial. Simulated trials are repeated examples, not multiple sessions the user should play.
Actual loss is not capped by expected cost. In the two-outcome model, a trial can lose all turnover if it records no hit. In a real slot, the maximum possible session loss depends on stakes, number of paid decisions, returns restaked and the player’s stop point.
Feature purchases require their full charged amount as stake. Do not enter the base denomination for a 100x purchase. The separate expected-cost calculator is better suited to transparent turnover arithmetic.
No recovery memory
Each trial is independent of the previous one
The seeded generator produces a repeatable sequence, and each spin is compared with the chosen probability. The code does not increase the chance after a loss or decrease it after a win.
This models independence: previous outcomes do not create a debt that the next spin must settle. A run of zero returns is compatible with the model and does not make an immediate hit due.
Sample convergence emerges across many observations; it is not enforced by a balancing routine. The mean can move closer to theory even though the final spin has the same probability as the first.
Real games can contain persistent state inside a documented feature, such as collected symbols or remaining Free Spins. Those rules create conditional states but do not justify a general belief that unrelated losses raise future win probability.
For a formal distinction between independent outcomes and stateful exceptions, use the independent RNG outcomes guide.
Deliberate omissions
What this simulator cannot establish
It cannot certify, test or reverse-engineer a named slot. The model has no reel strips, symbol weights, paytable, feature states, jackpot contribution, maximum-win truncation or game-specific volatility curve.
It cannot estimate a safe session length. More spins narrow the percentage distribution while increasing turnover. A result that looks statistically stable can still represent a larger expected monetary loss.
It cannot prove fairness from a short observation. Reliable actual-RTP monitoring requires complete, trustworthy win and turnover records tied to the same configuration and evaluated using the relevant regulatory or certification method.
It cannot predict a jackpot, bonus or cash-out outcome. Operator withdrawal rules and game maximum wins are separate from RTP. The simulation sends no request to a casino and has no access to operator data.
It cannot supply a betting system. Changing stake after losses does not change the entered expectation and can accelerate exposure. The chart is an explanation of variability, not a strategy for recovering money.
Three controlled experiments
Worked comparisons to try
Short versus longer sample
Use 96% RTP, 20% hit probability, 2,000 trials and seed 240116. Compare 50 with 5,000 spins. The larger sample should produce a tighter percentage histogram, while expected cost rises from 2 times stake to 200 times stake.
Same RTP, rarer awards
Use 500 spins and change only hit probability from 40% to 5%. The winning return rises from 2.4x to 19.2x to preserve the 96% mean. The rare-hit model should show a wider, more stepped distribution.
Different theoretical settings
Hold every other input constant and compare 96% with 90%. The distribution shifts downward because the one-win return is recalculated. The distance between means is long-run expectation, not a promised difference between two individual trials.
Change one field at a time and preserve the seed. That makes the cause of a chart change easier to interpret. Changing sample size, hit probability, RTP and seed simultaneously produces a visual difference but no clean lesson.
Repeatable by design
How to reproduce and audit a run
Record the six inputs shown above: RTP, stake, spins per trial, trial count, hit probability and seed. Using the same browser implementation and values should reproduce the same percentile and histogram outputs.
The tool limits total simulated spins to five million so it remains responsive on ordinary mobile hardware. If spins multiplied by trials exceed that limit, reduce one value. This performance guard is not a statistical recommendation.
Percentiles use a sorted array and linear interpolation between neighbouring ranks. The histogram uses twelve equal-width bins from the lowest to highest observed realised RTP. If every trial is identical, the chart shows one full bin.
Numbers are rounded only for display. Calculations use JavaScript floating-point arithmetic, which is adequate for an educational demonstration but not a substitute for a provider’s precision and certification controls.
No input leaves the page. The simulation runs locally in the browser, and reset restores the documented example. Reloading also returns the defaults because this page does not store a gambling log or account history.
New Zealand readers
What the NZD label does and does not mean
Stake and expected cost are formatted in New Zealand dollars for readability. The tool does not claim that a provider offers the selected stake or game configuration in NZD.
Operator identity, territorial terms, legal status, age controls, deposits, withdrawals, complaints and self-exclusion require separate checks. A correct simulation input cannot validate any of them.
New Zealand’s online-gambling position is time-sensitive. Use current Department of Internal Affairs guidance and our dated legal-status guide at the point of use.
For safer use, treat the simulator as a classroom diagram. If gambling is no longer recreational, stop and use the contacts on our responsible gambling page.
Before quoting the chart
RTP simulation checklist
- State that the model has only zero or one fixed winning return.
- Name the entered theoretical RTP; do not infer it from the output.
- Keep hit probability labelled illustrative unless a provider defines it.
- Record spins, trials and seed with any screenshot.
- Do not call the percentile interval a certified game range.
- Do not interpret the lowest and highest run as possible limits.
- Separate percentage convergence from rising money turnover.
- Verify a real game’s RTP in its current deployed help.
- Keep operator and New Zealand access claims outside the simulation.
- Never use the result as a recovery or staking strategy.
If reproducing the result elsewhere, describe the payout convention: a winning spin returns the displayed multiple of total stake, while a losing spin returns zero. Without that definition, identical-looking inputs can create different models.
Questions answered
Frequently asked questions
Does a 96% RTP mean a 100-spin session should return 96%?
No. The percentage describes a long-run mathematical average. A 100-spin realised return can be far above or below it, especially when awards are uncommon or uneven.
Why does the simulator ask for hit probability?
RTP alone gives a mean, not a full distribution. The illustrative hit probability lets the tool create a transparent two-outcome model with the same mean but different short-sample spread.
Is this a simulation of a specific casino game?
No. Every simulated round either returns zero or one calculated win amount. Real slots can have many prize levels, features, jackpots and caps, so this is only a teaching model.
Does a larger sample make a player more likely to recover losses?
No. More observations usually make the sample percentage less erratic around its expectation, but more paid rounds also create more turnover and expected monetary cost.
Can the result verify a game’s advertised RTP?
No. A short observed sample cannot reconstruct certified mathematics. Verify theoretical RTP in the exact deployed help; actual RTP monitoring requires reliable game records and much larger datasets.
Evidence record
Primary sources
Facts and configurations were checked against the following first-party records. A public product page is not proof that a game is available through a New Zealand operator.
- Evolution — Slots: RNG, RTP and volatility overviewChecked 6 October 2026
- UK Gambling Commission — how to calculate actual RTPChecked 6 October 2026
- UK Gambling Commission — theoretical and actual RTP monitoringChecked 6 October 2026
- UK Gambling Commission — player guide to RTP and random machinesChecked 6 October 2026
- New Zealand Department of Internal Affairs — online gambling for playersChecked 6 October 2026