Short answer
Frequency asks “how often”; volatility asks “how far”
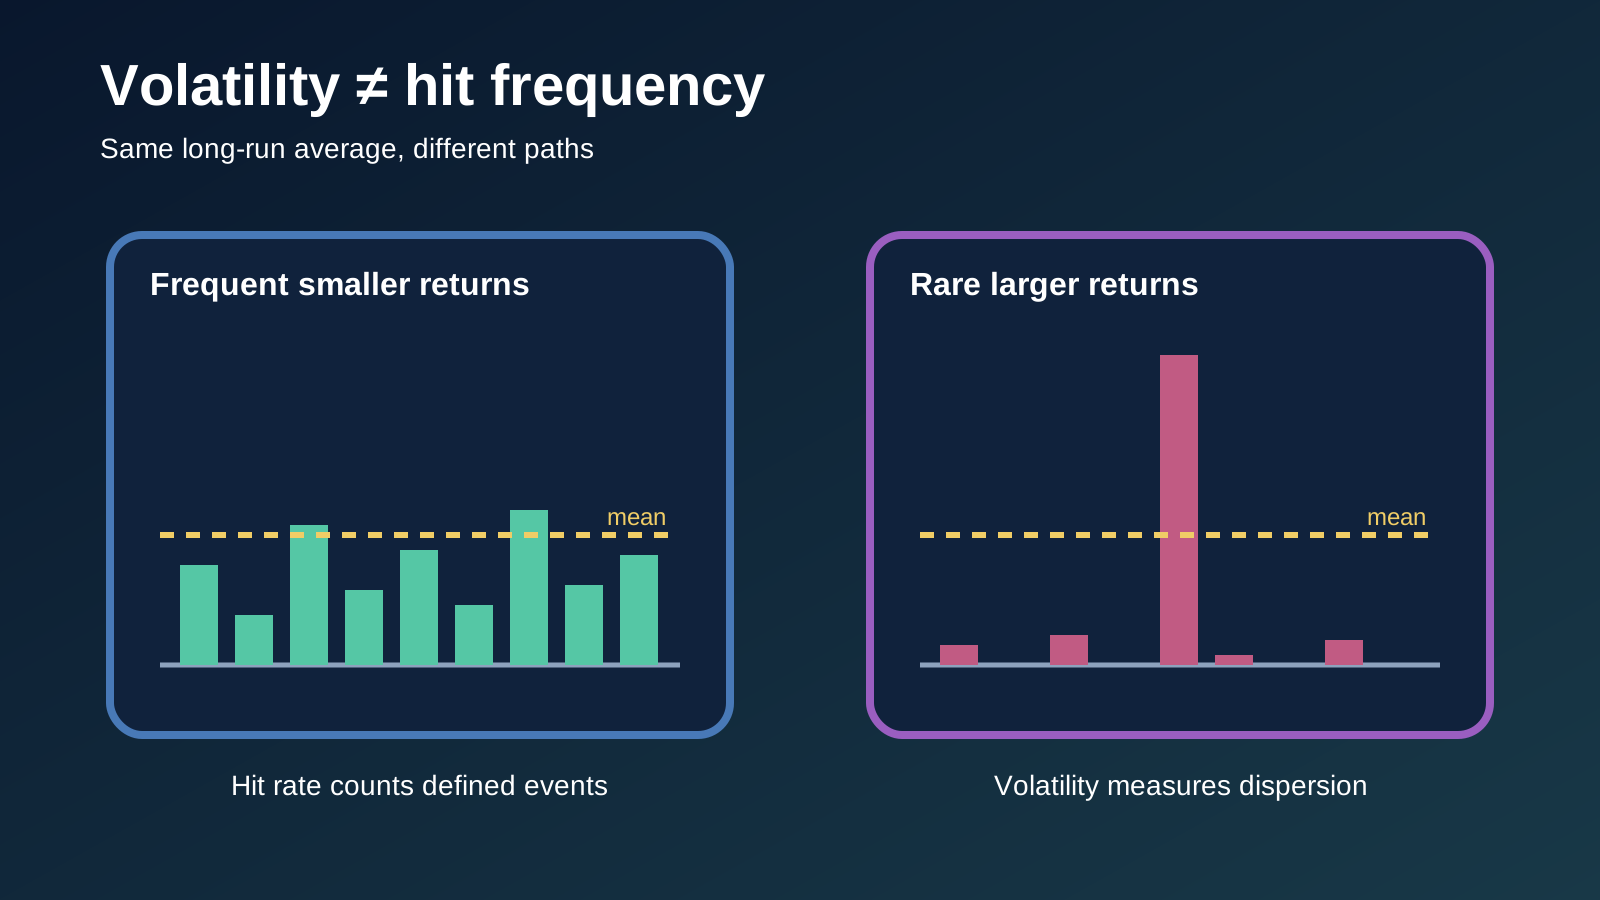
Hit frequency is the long-run share of rounds that produce a result counted as a hit under the game's rules. Volatility—also called variance in general explanations—describes how widely the monetary results are dispersed around their average. One is a count of qualifying events; the other is a description of the size and unevenness of returns.
The two can move together, but there is no rule that forces them to. A low-frequency game often needs larger wins to reach its designed return. Yet a high-frequency title can also be volatile if most hits return only a fraction of the stake while rare features carry a large share of RTP.
RTP answers a third question: the model's long-run average return relative to turnover. Two games can both publish 96% RTP, both register a hit on roughly one spin in four, and still have very different volatility because the sizes and probabilities of those hits differ.
None of these measures predicts the next spin. They describe a probability distribution built into a particular game configuration. A personal session can land far from every long-run average, especially when rare prizes contribute materially to the model.
- Hit frequency
- Rate of defined hits
- Volatility
- Spread of returns
- RTP
- Long-run mean
- Next spin
- Not predicted
Distribution
What slot volatility measures
Volatility describes how much results vary around the expected return. In a lower-volatility design, a larger share of return tends to arrive through smaller and more regular awards. In a higher-volatility design, outcomes are more widely spread and more return may depend on uncommon, larger awards.
“High” does not mean the slot has a better maximum or a lower RTP. It means the path through random outcomes is more uneven. A high-volatility model can have a modest cap, while a lower-volatility model can advertise a large maximum that contributes very little to ordinary play.
The New Zealand Government's regulatory-impact material uses the same practical distinction: low-volatility games give a higher chance of wins that are likely to be small. That description is useful, but it is still a broad category rather than a universal calculation shared by every provider.
When a supplier publishes standard deviation or a numeric volatility index, that exact first-party measure is stronger than a reviewer's label. When it publishes only “low,” “medium” or “high,” treat the word as a relative guide within that supplier's catalogue.
Event rate
What hit frequency measures
Hit frequency is calculated as qualifying hits divided by total rounds, expressed as a percentage. If a game's documented definition counts 25,000 hits in a mathematical sample of 100,000 rounds, its hit frequency is 25%.
That does not schedule a win every fourth spin. Random events cluster. Four hits can occur consecutively, followed by a much longer non-hit run, while the large sample still approaches one in four.
The critical word is “qualifying.” Some documents count any positive payout, including an award smaller than the stake. Others distinguish a win event, a break-even return, a feature trigger or a profitable round. A percentage without its definition is incomplete.
Hit frequency also says nothing by itself about hit size. A game that pays $0.20 after a $1 stake records an event under many definitions even though the balance fell by $0.80. The experience can feel busy while the session still trends down.
Related, not synonymous
Why frequent hits do not prove low volatility
Imagine a game where 30% of rounds return something. If almost every hit pays close to the stake and large prizes are tightly limited, the distribution can be relatively narrow. Now imagine another 30%-frequency game where most hits pay 0.1x and a rare bonus can pay thousands of times the stake. Their hit counts match, but their spreads do not.
The second design can register many “wins” without smoothing the balance. Tiny partial returns keep the hit counter high while a large share of mathematical value sits in the tail. Volatility captures that unevenness; hit frequency alone cannot.
The reverse matters too. A lower hit rate does not automatically mean extreme volatility if the successful outcomes occupy a fairly narrow band and the top prize is constrained. Fewer events and wider monetary dispersion often coincide, but they are not the same variable.
For comparison, pair a defined hit rate with RTP, maximum win, feature structure and an official volatility label or index. Any one field in isolation can create a misleading picture of how the balance may move.
Mean versus spread
How volatility and hit frequency relate to RTP
Theoretical RTP is the probability-weighted average of all awards divided by the stake. The UK Gambling Commission distinguishes that designed figure from actual RTP, which is calculated as recorded wins divided by turnover.
Volatility does not replace RTP. RTP locates the long-run mean; volatility describes how broadly individual results can fall around it. Hit frequency provides one event-rate view of the distribution but does not show the monetary weight of those events.
A 96% RTP corresponds to a 4% theoretical house edge when all included outcomes use the same stake basis. Changing the distribution can leave that 96% mean unchanged. The game can move return from frequent 1x awards into rarer 100x awards and become more volatile without changing the average.
Likewise, raising hit frequency can leave RTP unchanged if average hit size falls. The arithmetic must balance across the entire model. A larger number of counted events is not free value.
The formal idea
Variance and standard deviation in plain language
For a random return X with expected value μ, variance is the expected squared distance from that mean: E[(X − μ)²]. Squaring gives extra weight to outcomes far from the average. Standard deviation is the square root of variance and expresses the spread in the original unit.
Slot returns are usually asymmetric. Most rounds may be zero or small, while a long right tail contains rare large prizes. Two models with the same mean can therefore produce very different standard deviations.
The UK Gambling Commission's monitoring example shows why this matters. It uses game volatility to set tolerances around theoretical RTP: a limited sample can sit materially above or below the design, while the expected range narrows as the number of games grows.
Consumer labels rarely expose the full probability table needed to calculate variance. Do not reverse-engineer a precise index from a short demo. Use the supplier's published measure where available and keep qualitative conclusions appropriately limited.
A common source of confusion
What counts as a “hit” or “win”
A positive payout can still be a net-loss result. Stake $1, receive $0.40, and the interface may celebrate a win while the balance is down $0.60. If the model counts every positive award, that round contributes to hit frequency.
Some games also contain non-paying feature events, such as collecting a meter symbol or triggering a visual modifier that produces no final award. These may feel like activity but should not be counted as monetary hits unless the first-party definition says so.
Feature frequency is separate again. A bonus can trigger once in a stated number of rounds while ordinary line wins occur much more often. Substituting bonus frequency for overall hit rate makes the game appear far quieter than it is.
When a review prints “one in four spins wins,” look for the source and denominator. Does it count any payout, return at least the stake, enter a feature or finish in profit? Without that explanation, keep the number out of a decision table.
Worked model
Two 96% games can feel nothing alike
In a simplified Game A, 30% of rounds pay an average of 3.2x the stake and 70% pay zero. The mean is 0.30 × 3.2 = 0.96, or 96% RTP. Its hit frequency is 30% under the any-positive-payout definition.
In simplified Game B, 20% of rounds pay an average of 4.8x and 80% pay zero. The mean is also 0.20 × 4.8 = 0.96. The lower hit rate requires a higher average successful award to preserve the same mean.
Real slots are much more complex: they include many prize sizes, features, multipliers, caps and sometimes separate bet modes. The example demonstrates the relationship, not a claim that all 30% games are low volatility or all 20% games are high.
A third game could hit on 40% of rounds but return 0.1x on most hits and reserve substantial RTP for a very rare 1,000x event. Its visible frequency would be high while its tail could still create strong volatility.
Random spacing
Hit frequency does not cap a dry spell
A 25% hit frequency is a long-run rate, not a promise that four consecutive rounds contain one hit. Independent random rounds allow much longer gaps. The chance of ten consecutive non-hits in a simplified 25% model is 0.75 raised to the tenth power—about 5.6%.
That calculation assumes a constant independent hit probability and one clear definition. Real features may introduce state within a round, but finished paid rounds do not normally create a debt that the next result must repay.
A long gap is therefore compatible with the stated model. It does not prove that a win is due. Increasing stake after a dry sequence raises exposure but does not repair the previous outcomes.
The separate slot RNG independence guide explains why sequence history cannot change the next comparable draw and where documented game state creates a legitimate exception.
Several hits can also cluster together. A busy minute does not show that volatility has fallen, just as a quiet minute does not establish that the published hit rate is false. Samples need scale and statistical context.
Where the tail can hide
Bonuses, multipliers and persistent states
Modern slots can place a meaningful share of RTP inside Free Spins, collection bonuses, progressive multipliers or rare modifier combinations. Ordinary spins may return small amounts frequently while the feature tail drives volatility.
A persistent meter can change the conditional state defined by the rules. That does not make the game remember losses. Read what carries over, when it resets and whether the progress is cosmetic, paid or tied to a single feature.
Bonus buys and enhanced spins may have separate RTP and distribution. A purchase guarantees a route only when the help says so; it does not guarantee a positive result. Its price can create much larger immediate balance movement than ordinary play.
Do not combine hit frequency from the base game with the average feature return unless the supplier publishes a method. Those statistics can use different denominators and answer different questions.
Boundary, not frequency
Maximum win does not measure volatility
A maximum-win figure states the ceiling for settlement. It does not state how often the ceiling is reached, how much RTP it contributes or what a typical successful round pays.
Two games can both cap at 10,000x while one concentrates most return below 20x and the other places more weight in bonuses above 100x. Their headline maximum is identical, but their distributions and session behaviour can differ.
Some titles change the cap by mode. A low-volatility level may stop at 250x while a high level reaches 10,000x. Any comparison should record the selected mode with the cap and stake limit.
Treat the cap as a rules check, not a goal. Chasing a remote maximum increases turnover and expected loss; it does not cause the RNG to move closer to the boundary.
No universal scale
Why provider volatility labels conflict
One studio may use three categories, another five levels and another a numeric index. Thresholds can differ, and review sites often translate an internal scale into their own language without documenting the mapping.
“Medium-high,” “high 4/5” and “8/10” are not automatically equivalent. Preserve the exact first-party term and cite the date and build. If the current help omits volatility, say so rather than inventing precision.
Marketing intensity is not mathematical evidence. Words such as “explosive,” “high-octane” or “action-packed” describe presentation. They should not be converted into a volatility rating unless the provider explicitly connects them.
For cross-studio comparison, the most honest approach is a bundle of fields: active RTP, provider's volatility label, defined hit frequency, feature structure, cap and optional-route costs. The bundle exposes uncertainty instead of hiding it behind one badge.
Exposure control
What the measures can—and cannot—do for a budget
Volatility can help a reader understand that balance paths may be smoother or more uneven. It cannot guarantee that a low-volatility game preserves a deposit or that a high-volatility game produces one large award before the money is spent.
Hit frequency can describe how busy the interface may feel. It cannot show net cost when many hits are below the stake. Use total stake, number of paid rounds and the theoretical edge for exposure calculations.
A practical limit is budget divided by total bet, assuming every round can lose. This gives a maximum number of full-loss rounds, not an estimate of how long the session will certainly last. Returned prizes can extend play and increase turnover.
Feature purchases require a separate check because one click can cost tens or hundreds of ordinary bets. Treat the full displayed price as exposed immediately and never raise the base stake to recover a lost purchase.
Useful for rules, weak for measurement
What a free demo can establish
A first-party demo can reveal the exact title, interface, help version, RTP, feature rules, stake controls and maximum-win wording. It is valuable evidence when the information panel is current and the game ID is recorded.
Demo outcomes are not enough to estimate volatility or hit frequency reliably. Hundreds of spins can still miss rare events that materially affect the mathematical model. A personal sample also lacks the certified probability table.
Autoplay or rapid spinning does not fix the sample problem. More rounds increase data but also encourage false confidence long before the tail has been observed adequately. Use published first-party statistics instead of presenting session notes as measurement.
A global demo also does not prove real-money availability in New Zealand, an operator's active RTP or legal status. Those claims need operator-level and current regulatory evidence.
Verification workflow
How to audit one game's risk information
- Match the full title, provider and game ID or version.
- Open the deployed help rather than relying on a lobby card.
- Record theoretical RTP and any separate route returns.
- Copy the volatility wording exactly; do not translate scales casually.
- Record hit frequency only with its definition and source.
- Note the maximum win, selected mode and total stake unit.
- Check feature purchases, enhanced bets and their costs separately.
- Date the record because operators can change builds.
If the live help and a review disagree, the deployed help controls that client. A different percentage can indicate an alternative certified build rather than a typographical error.
If hit frequency is absent, leave it absent. Maximum win, a handful of demo spins or a provider's volatility label cannot be converted into an exact rate.
Fast corrections
Seven common volatility and frequency myths
- “High hit rate means low risk.” Small partial returns can inflate the count while rare prizes drive volatility.
- “High volatility means low RTP.” Mean and dispersion are separate properties.
- “One in four means the fourth spin wins.” Random events have irregular spacing.
- “A big cap proves high volatility.” Probability weights, not the boundary alone, determine spread.
- “A long dry spell makes a hit due.” Independent rounds do not repay a sequence.
- “A demo can measure the game.” A personal sample is too small to recover the full distribution.
- “All high labels mean the same thing.” Provider scales are not standardised.
Local evidence boundary
What New Zealand readers should verify separately
This mathematical guide does not recommend an operator. New Zealand's online-gambling position is time-sensitive, so consult current Department of Internal Affairs guidance and the site's dated legal-status guide.
An NZD wallet or local flag does not prove operator status. Verify identity, territorial terms, age controls, payments, withdrawals, complaints, account limits and self-exclusion independently from the game mathematics.
A correct volatility label does not make an operator suitable, and a legitimate operator can deploy a lower-RTP version. Keep regulatory, operator and game-build checks as separate evidence chains.
If play stops being recreational, use the resources in the site's responsible gambling guide. Understanding variance explains uncertainty; it does not remove the house edge or make a slot an income product.
Comparison sheet
Compare two games without collapsing the metrics
Start with active RTP and convert it to theoretical edge. Then copy the provider's volatility label and any documented standard deviation. Add hit frequency only when the definition is available.
Next record maximum win, feature concentration, bonus-buy prices, enhanced-bet costs and any modes that change the cap. These fields explain why identical percentages can produce different practical exposure.
Finally compare total stake and speed. A smoother game played faster or at a higher stake can expose more money than a volatile game used briefly. Product labels do not replace a pre-set budget.
For the long-run average behind this comparison, read the site's theoretical slot RTP and house-edge guide. Together, the two pages separate mean, spread and event frequency without pretending to forecast a session.
Questions answered
Frequently asked questions
Is hit frequency the same as volatility?
No. Hit frequency counts how often an outcome meets the game’s definition of a hit. Volatility describes the spread and size distribution of returns. Frequent very small hits can coexist with rare large prizes and high volatility.
Does high volatility mean a low RTP?
No. RTP is the long-run mean and volatility is dispersion around that mean. A high- and low-volatility game can share the same theoretical RTP.
Does a 25% hit frequency mean one win every four spins?
It means roughly one defined hit per four spins in the model’s long-run average. Random spacing can include several hits together and much longer gaps. The definition may also count returns below the stake.
Can a demo reveal a slot’s volatility?
A demo can show mechanics and give a limited impression, but a personal sample is too small to measure a model reliably. Prefer the current first-party help, math sheet or certified label.
Which metric predicts the next spin?
Neither. Random slot rounds are independent except where the rules explicitly preserve feature state. RTP, volatility and hit frequency describe distributions, not a next-result forecast.
Evidence record
Primary sources
Facts and configurations were checked against the following first-party records. A public product page is not proof that a game is available through a New Zealand operator.
- UK Gambling Commission — how to calculate return to playerChecked 6 October 2026
- New Zealand Government — reducing pokies harm regulatory impact statementChecked 6 October 2026
- Evolution — slots and game conceptsChecked 6 October 2026
- NSW Government research — survey of gaming-machine volatilityChecked 6 October 2026
- New Zealand Department of Internal Affairs — online gambling for playersChecked 6 October 2026